
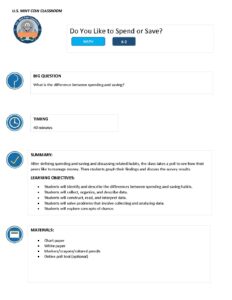
Summary
After briefly discussing spending and saving habits, the class takes a poll to see how their peers like to manage money. Then students graph their findings and discuss the survey results.
Objectives
- Students will identify and describe the differences between spending and saving habits.
- Students will collect, organize, and describe data.
- Students will construct, read, and interpret data.
- Students will solve problems that involve collecting and analyzing data.
- Students will explore concepts of chance.
Subject Area
- Coins & Mint
Grades
- K
- 1st
- 2nd
Class Time
- Total Time: 0-45 Minutes minutes
Materials
- Chart paper
- White paper
- Markers/crayons/colored pencils
- Piggy Bank Template (optional)
- Online poll tool (optional)
Lesson Steps
Define Spending and Saving and Discuss Habits (10 minutes)
-
- Write or project the word Saving on the board, leaving space under the word for a small list. Ask students if they have heard this word before. Explain that saving is when you keep things to use later. For example, if you had a snack and didn't eat the whole thing, you might save the rest for later. Saving is important when it comes to money. If you save your money, you can spend it later on something big. Ask the class to name something that they might need to save up their money for (e.g., ticket to the movies, candy, new video game).
- Ask students to think about what they would do when they are saving. What does saving look like? If they have trouble, here are some suggestions:
- Put change in a piggy bank
- Ask your parents to deposit your money in a bank account
- Keep bills inside a wallet or envelope
- Choose not to buy something right now
- Think about something big you want and keep your money somewhere until you have enough
- Next write or project the word Spending on the board. Ask students if they have heard this word before. Explain that spending is using your money to buy something. For example, if you earned $1 by doing a chore or as a present, you could go to the store and spend that $1 right away.
- Ask students to think about what they would do when they are spending. What does spending look like?
- Buying a treat at the store
- Renting a movie or video game
- Buying a new toy
- Getting a present or gift for a friend
- Share or donate money to those who need it
- Explain that now the class will see which we like to do better.
- To conduct a poll using paper, follow the instructions below:
- Give each student a paper square and crayons. Have them draw a piggy bank to represent their own money, or use the Piggy Bank Template.
- Ask the students whether they like to spend or save. To answer the question, have each student come to the front of the room and glue or tape their bank under Spend or Save on the graph.
- Ask the class to help you draw a bar graph of the results on the board. If working with students who are older (1st or 2nd grade) or more advanced, ask them to create their own graph using the data the class collected.
- To conduct an online poll, select the polling tool of your choice (e.g., Google Classroom, Plickers, Poll Everywhere, etc.)
- Prior to class, set up your poll with at least one question: Do you like to spend or save? You may also want to include knowledge check questions about saving and spending.
- Launch the poll.
- Ask students to complete the poll using the method required for the polling tool you've selected.
- Before you show students the results, ask them to predict whether they think the class likes spending or saving more.
- As a class, analyze the results. Ask questions such as:
- How many students in our class like to save their money?
- How many like to spend their money?
- How many more people in our class like to do one more than the other?
- What else can you tell about the students in our room from this graph?
Differentiated Learning Options
- Create a class "piggy bank" out of a shoe box or other vessel. Have students place their papers inside the box. Then, ask several students to help count and tally the results on the board / chart paper.
- Introduce or continue the discussion with your class about spending and saving concepts using online videos or books.
- Money Savvy Videos, Washington State Department of Financial Institutions: https://dfi.wa.gov/financial-education/money-savvy-videos
- Online readings of children's books about financial literacy, Missouri Treasury: https://treasurer.mo.gov/financial-literacy/patchildrensbooks
- List of money-related children's books, Consumer Financial Protection Bureau (CFPB): https://www.consumerfinance.gov/consumer-tools/money-as-you-grow/bookshelf/
Assess
Observe and discuss the activity and how students answered the poll questions to determine if they have met the lesson objectives.
Common Core Standards
CCSS.MATH.CONTENT.K.MD.B.3
Classify objects and count the number of objects in each category.
CCSS.MATH.CONTENT.K.CC.C.6
Identify whether the number of objects in one group is greater than, less than, or equal to the number of objects in another group, e.g., by using matching and counting strategies
CCSS.MATH.CONTENT.K.CC.C.7
Compare two numbers between 1 and 10 presented as written numerals
CCSS.MATH.CONTENT.1.MD.C.4
Organize, represent, and interpret data with up to three categories; ask and answer questions about the total number of data points, how many in each category, and how many more or less are in one category than in another.
National Standards
Jump$tart National Standards
Standard 1. Develop a plan for spending and saving
National Standards
Discipline: Mathematics
Domain: K-2 Data Analysis and Probability
Cluster: Develop and evaluate inferences and predictions that are based on data.
Grade(s): Grades K–2
Standards:
In K through grade 2 all students should
Discipline: Mathematics Domain: K-2 Data Analysis and Probability Cluster: Formulate questions that can be addressed with data and collect, organize, and display relevant data to answer them. Grade(s): Grades K–2 Standards: In K through grade 2 all students should
- discuss events related to students' experiences as likely or unlikely.
Discipline: Mathematics Domain: K-2 Data Analysis and Probability Cluster: Formulate questions that can be addressed with data and collect, organize, and display relevant data to answer them. Grade(s): Grades K–2 Standards: In K through grade 2 all students should
- pose questions and gather data about themselves and their surroundings;
- sort and classify objects according to their attributes and organize data about the objects; and
- represent data using concrete objects, pictures, and graphs.
Subscribe to our
Lessons that Make Cents newsletter.