Summary
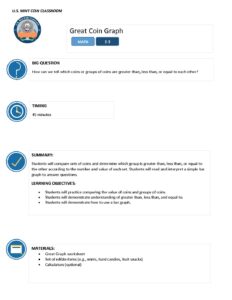
Students will compare sets of coins and determine which group is greater than, less than, or equal to the other according to the number and value of each set. Students will read and interpret a simple bar graph to answer questions.
Objectives
- Students will practice comparing the value of coins and groups of coins.
- Students will demonstrate understanding of greater than, less than, and equal to.
- Students will demonstrate how to use a bar graph.
Subject Area
- Math
Grades
- 2nd
- 3rd
Class Time
- Total Time: 0-45 Minutes minutes
Materials
- Great Coin Graph! worksheet
- Set of edible items (e.g., mints, hard candies, fruit snacks)
- Calculators (optional)
Lesson Steps
Review what students already know about comparing quantities (10 minutes)
1. Start this lesson by comparing different quantities of the same items in your room (e.g., pencils, crayons, markers).
2. Use a set of edible treats (e.g., mints, hard candies, fruit) and place them into groups of varying quantities. Ask students to identify how many items are in each group. Write these numbers on the board. If teaching virtually, use a virtual whiteboard.
3. Tell students that there is a way to show which group or number is larger. Ask them which group of items a hungry person would pick.
4. After students correctly identify the larger group, draw the greater than (or less than) symbol between the two numbers written on the board. Point out to students how the symbol resembles the mouth of a hungry person gobbling up the largest amount.
5. Do several more sets of numbers for practice, varying the use of the "greater than" and "less than" symbols (also incorporate "equal to"). Tell students that almost anything can be compared using this method—even money, specifically coins.
Review value of coins and complete worksheet (30 minutes)
6. Review the value of a cent (penny), nickel, dime, and quarter as a class.
7. Introduce the Great Coin Graph! worksheets. Review the directions with the class, explaining that first, everyone has to count the numbers of coins and draw a bar graph.
- If you would like to use coins or paper coins, you can give each student or group of students 23 pennies, 19 nickels, 20 dimes, and 13 quarters.
- The worksheet includes coins for students to count out.
- The worksheet answer key works assuming you use 23 pennies, 19 nickels, 20 dimes, and 13 quarters.
Differentiated Learning Options
- Have students orally answer and discuss the questions on the worksheet.
- Allow students to use play money to represent the amounts in the graph.
- Add sublines to the "Great Coin Graph" worksheet to help students better read the graph.
Assess
Use the students' participation in the discussion, ability to differentiate between the greater than, less than and equal to, and their answers on their worksheet to assess whether they have met the lesson objectives.
Common Core Standards
CCSS.MATH.CONTENT.1.MD.A.1
Order three objects by length; compare the lengths of two objects indirectly by using a third object.
CCSS.MATH.CONTENT.2.MD.A.1
Measure the length of an object by selecting and using appropriate tools such as rulers, yardsticks, meter sticks, and measuring tapes.
CCSS.MATH.CONTENT.2.MD.A.2
Measure the length of an object twice, using length units of different lengths for the two measurements; describe how the two measurements relate to the size of the unit chosen.
National Standards
Principles and Standards for School Mathematics, National Council of Teachers of Mathematics
Discipline: Mathematics
Domain: K-2 Number and Operations
Grade(s): Grades K–2
Subscribe to our
Lessons that Make Cents newsletter.

